

排名
6
文章
6
粉丝
16
评论
8
{{item.articleTitle}}
{{item.blogName}} : {{item.content}}
ICP备案 :渝ICP备18016597号-1
网站信息:2018-2026TNBLOG.NET
技术交流:群号656732739
联系我们:contact@tnblog.net
公网安备: 50010702506256
50010702506256

欢迎加群交流技术

 分类:
前端
分类:
前端
一:使用npm下载highcharts依赖
npm install highcharts --save这步一定要做,否则即使执行了npm install highcharts-vue也会提示找不到vue这个库
二:安装highcharts-vue
npm执行:
npm install highcharts-vue
三:注册highcharts
1:全局注册
若想要在应用程序的任何位置使用本插件,请使用全局注册方法。在您的主应用程序文件中导入 Vue 和 Highcharts-Vue 扩展包
import Vue from 'vue'
import HighchartsVue from 'highcharts-vue'
接下来,您可以将其注册为 Vue 对象中的插件:
Vue.use(HighchartsVue)
2. 局部注册
若仅用于特定组件,请使用局部注册方法。首先,您应该从组件文件中的 Highcharts-Vue 包中导入 Chart 组件对象:
import {Chart} from 'highcharts-vue'然后,您需要在 Vue 实例配置中注册它,即在 components 部分中
{
    components: {
        highcharts: Chart
    }
}
四:开始使用
直接看代码:
<template>
    <NewsLayout>
        <highcharts :options="chartOptions"></highcharts>
    </NewsLayout>
</template>

<script>
    import NewsLayout from '../../pages/News.vue';
    import { Chart } from 'highcharts-vue';

    export default {
        components: {
            NewsLayout,
            highcharts: Chart
        },
        data: function () {
            return {
                chartOptions: {
                    title: {
                        text: '欢迎使用TNBLOG'
                    },
                    chart: {
                        type: 'spline'//图表类型,column,line,spline,area等
                    },
                    subtitle: {
                        text: '数据来源:www.tnblog.net'
                    },
                    series: [{
                        data: [1, 2, 3, 2, 1, 0, 3] // sample data
                    }]
                }
            }
        }
    }
</script>
效果如下: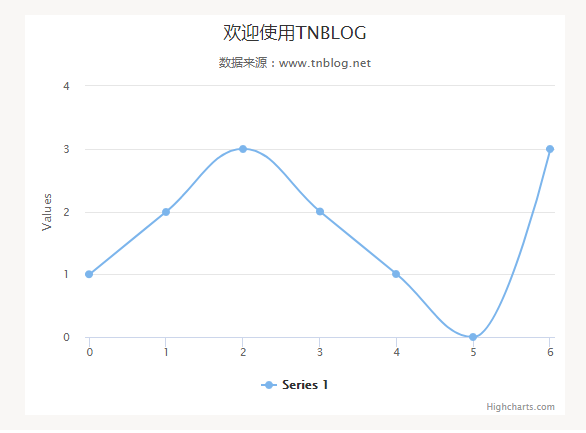
五:点击添加点
添加一个按钮
<input @click="addPoint()" value="点击添加点" type="button">
在事件里边去把对应的数据加一个随机的点即可
    methods:{
      addPoint:function(params) {
         let val = Math.floor(Math.random()*10);
         this.$data.chartOptions.series[0].data.push(val);
      }
    },
这样可以使可以,但是效果并不好,图表刷新太过明显
我们可以借助highcharts本身对象的addPoint方法来实现平滑添加点
代码如下:
<script>
  import MainLayout from '../layouts/Main.vue'
  import {Chart} from 'highcharts-vue'
  //先定义一个变量放着,等图表加载完成给他赋值
  var highchart ={};

  export default {
    components: {
      MainLayout,
      highcharts: Chart
    },
    methods:{
      addPoint:function(params) {
         let val = Math.floor(Math.random()*10);
         highchart.series[0].addPoint([this.$data.x,val], true, true);
         this.$data.x++;
      }
    },
    data:function(){
        return {
            x:6,//定义一个可以用的自增变量
            chartOptions: {
                chart: {
                  type: 'spline',
                  events: {
                      load: function () {
                          //给全局变量赋值,方便在按钮点击事件中拿到highchart对象
                          highchart = this;
                          //this.series[0].addPoint([6, 3], true, true);
                      }
                  }
                },
                series: [{
                    data: [0,1,0,1,0] // sample data
                }]
            }
        }
    }
  }
</script>
效果如下:
当然全局变量尽量少用
六:从后台加载数据
很简单比如在加载完成事件中去发送一个ajax请求后台拿到数据,更新数据源即可
<script>
    import NewsLayout from '../../pages/News.vue';
    import jquery from 'jquery';
    import { Chart } from 'highcharts-vue';

    export default {
        components: {
            NewsLayout,
            highcharts: Chart
        },
        created: function () {
            //动态更新图标数据
            //this.$data.chartOptions.series[0].data = [3, 2, 1, 3];
            //调用接口把得到的数据源赋值即可
            this.$http.get("/api/getdata").then(function (data) {
                this.$data.chartOptions.series[0].data = data.result;
            })
        },
        data: function () {
            return {
                chartOptions: {
                    title: {
                        text: '欢迎使用TNBLOG'
                    },
                    chart: {
                        type: 'spline'//图表类型,column,line,spline,area等
                    },
                    subtitle: {
                        text: '数据来源:www.tnblog.net'
                    },
                    series: [{
                        data: [1, 2, 3, 2, 1, 0, 3] // sample data
                    }]
                }
            }
        }
    }
</script>
主要代码看created即可
欢迎加群讨论技术,1群:677373950(满了,可以加,但通过不了),2群:656732739。有需要软件开发,或者学习软件技术的朋友可以和我联系~(Q:815170684)
评价